Simulations
There are two ways to run simulations in Stella. The first one is with the use of the interface and the second way is to do it directly in the model which is the topic of this section. The main advantage to do it directly in the model to compare to doing it with the interface, is a much larger number of interventions that can be considered. The disadvantage is that model manipulation requires certain level of knowledge and the user must be very careful not to alter model’s structure. For example, introduction of extreme values of certain variables may block the model. For this reason, it is advised to keep several versions of the model: in case of a wrong manipulation that is difficult to correct it is easy to revert to the version that works correctly.
Before you simulate:
a. Set up the time horizon for which you wish to run the simulation. Click on the empty space to open model settings and select the desired time range. More information on the model settings tab and other technical aspects of simulations can be found directly on the Isee Systems website. Please note, the choice of time horizon will determine the end results of BAU and all other scenarios as its value is used in calculation of performance.
b. Make sure all the necessary input files are correctly imported in the model. For calibrated model these are:
Input.csv,Parameters.csv, and optionallyInterventions.csv. Double check if their source in the import manager points out to the actual location on your computer.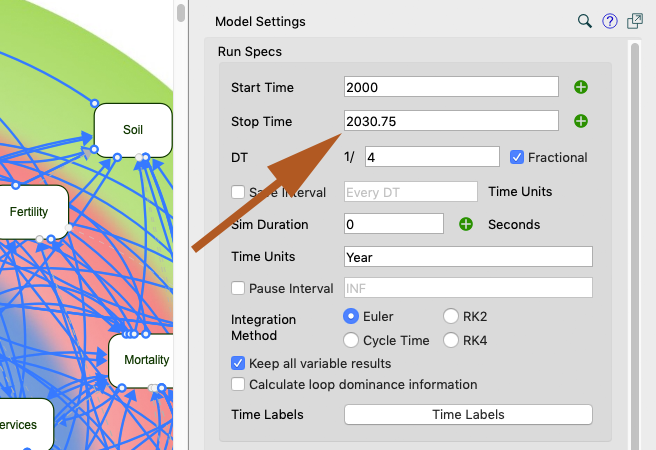
There are two ways one can input value of the variable whose effect on the rest of the model one wants to simulate.
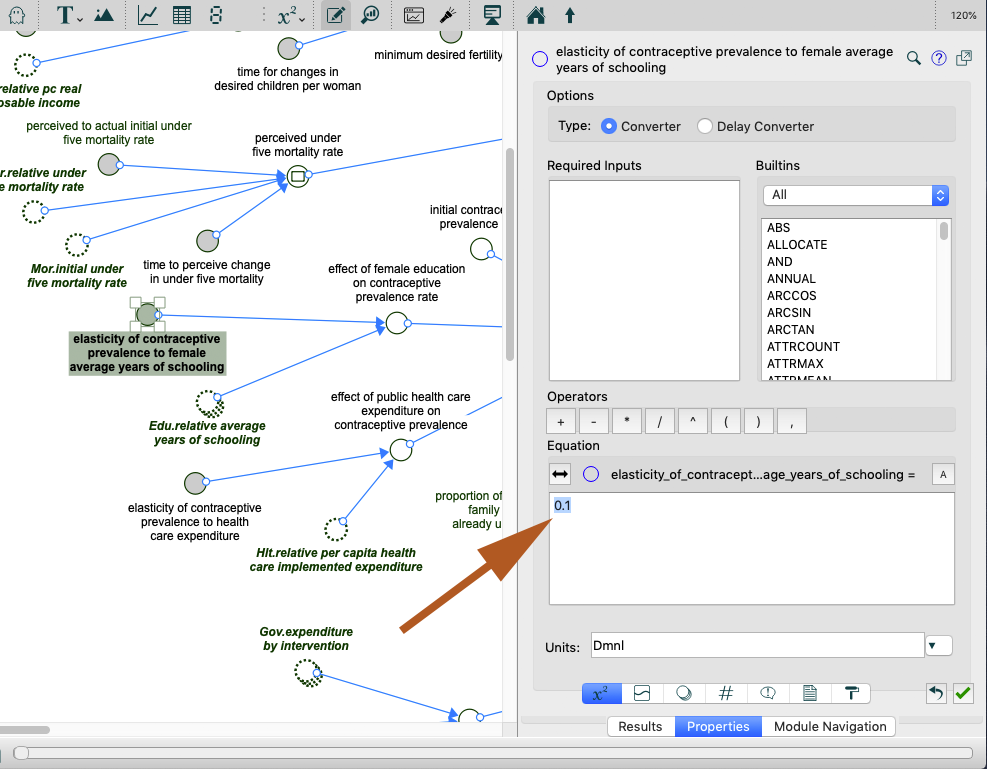
a. Manually: click on a variable, open its properties and modify the existing value in the editor window, then validate.
b. With the use of spreadsheets (see section on import procedures): This is particularly convenient if one wishes to alter value of multiple variables (interventions) simultaneously or make them time variant. Spreadsheet
interventions_example.csvprovides an example of an intervention input file. Most of government interventions are located in the “Government” sector.Press simulation button located on the bottom leftmost side of the window to run the simulation.

Investigate the results: Click on variable whose change resulting from intervention you wish to investigate; the result tab contains a graph with the n latest simulations.
To change the number of the displayed simulation runs go to Data Manager

You remove manually selected runs, shift them to the right-hand side window to remove them from the display without deleting or to manage the maximum number of displayed runs. For more information on the data manager refer to Isee System’s online tutorials.
SDG indicators
Performance of the SDGs is calculated in the SDG Indicators sector and this sub section describes the key elements of its content.
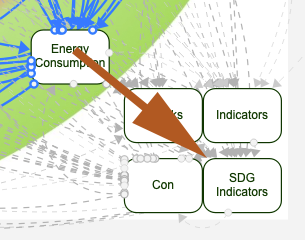
Variables relevant for computation of SDG indicators are copied from the different parts of the model, indicators are calculated, normalized and assembled in variable sdg indicators normalized which contains a time series for each indicator as well as its name.
Each SDG consists of a number of indicators with a target value determined by the international community. The model compares the value that each indicator takes in the final year of simulation (“stop time” in Model Settings) under BAU or other scenario, with the value it had in 2015. It then calculates the ratio of this difference to the difference between the target values and the values in 2015.
\(performance = \frac{value final year_{i} - value 2015}{target value - value 2015}\)
Where
i = a scenario
The variable sdg indicators performance contains future series of the estimated performance of all the available indicators. The variable sdg performance as indicates its name is the SDG performance obtained by computing arithmetic mean of performances of composing it indicators and its value corresponds to the “New run” value in the interface

The variable performance difference sdg (in certain model versions it may be performance difference sdg switch 1) illustrates the difference in performance between those obtained with a given scenario and those obtained with the base run (scenario BAU). When running BAU it will produce the series of zeros. It corresponds to “Net change” value in the interface.