User Interface Guide
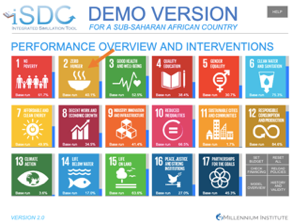
A brief introduction to the online user interface follows. This interface runs the iSDG model developed for a Sub-Saharan African country. This guide is not meant to be an exhaustive guide, but it describes the major functions of the UI.
The Millennium Institute (MI) is a nonprofit, non-governmental organization passionate about improving the welfare of individuals on every continent by working with stakeholders to meet the challenges of sustainable development.
In your web browser, go to https://exchange.iseesystems.com/public/millenniuminstitute/isdg-20/index.html#page1
Click the “Start” button to begin.
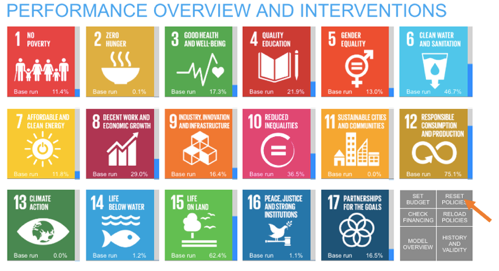
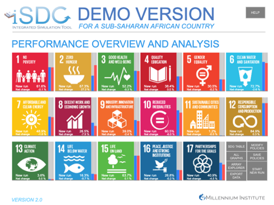
The following screen is the “control panel” for setting up simulations. You can modify the options for each simulation for each SDG. The red bars beside each objective represents the performance of the objective in 2030 in the base run (if no interventions are added after 2019). We will take Goal 2 as an example.
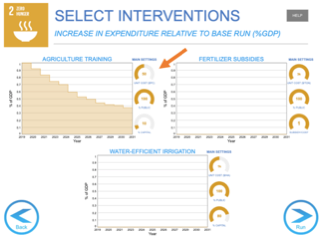
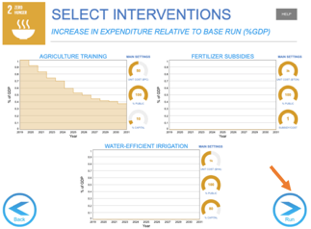
On this screen, you can change the level of investment of each intervention by clicking on the graph.
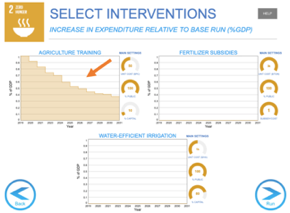
There are other options for certain interventions located beside each graph. These options generally change hypotheses for the simulation, for example, unit costs, level of investment in capital, or financing for each intervention. Change these options if necessary.
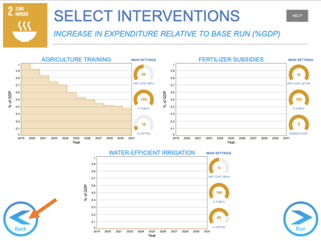
Once satisfied with the interventions and assumptions, click on “Back” to return to the Control Panel.
You may choose other interventions in the other Goals, if necessary. The interventions you have chosen are saved automatically.
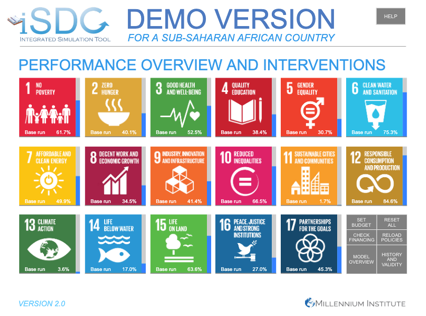
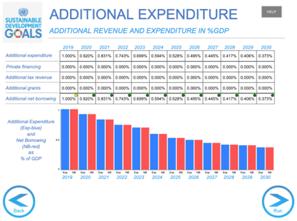
At any time, you may check the effect on the budget by clicking “Check Financing” on the control panel. Additional expenditure paid by private sources, taxes, grants and loans are presented (as a percentage of gross domestic product).
Once you’re satisfied with the interventions and the budget click on “Run” to start the simulation.
The performance of each goal is presented on the red bar beside each Goal. The blue bar remains the performance in the Business as Usual (BAU) scenario.
On the results screen, by clicking the objectives on the control panel, the effects of each intervention is shown. Click on the name of the variable of intrest to see a graph comparing it’s evolution in time under the new and the BAU scenarios.
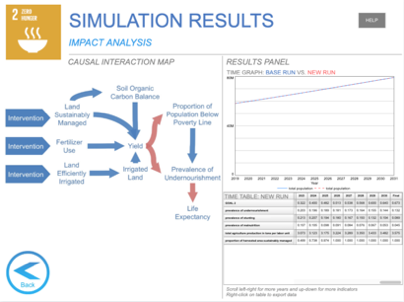
To modify the interventions and settings of your current simulation, click on “Modify Policies” on the control panel. To start a new simulation (delete interventions and settings), click on “Start New Run”.
List of interventions
SDG 1 – (No Poverty)
Subsidies and Transfers
Change the distribution by income percentile. Normally, the majority of transfers go to the lower percentiles.
SDG 2 – Zero Hunger
Agriculture Training
Fertilizer Subsidies
Water-efficient Irrigation
SDG 3 – Good Health and Well-being
General Health Services
Family Planning
SDG 4 – Quality Education
Public Education
Change the distribution of allocated budget by level of education.
SDG 5 – Gender Equality
Education Gender Bias
Ratio of girls to boys for each level of education
Productivity Gender Bias
Zero bias indicates, women can access work to equal degree as men who have received the same level of education. A positive value indicates bias against women.
Employment Gender Bias
When this bias is zero, women can access work at the same level as men, positive bias indicates bias against women from cultural differences.
SDG 6 – Clean Water and Sanitation
Water Infrastructure
Sanitation Infrastructure
SDG 7 – Affordable and Clean Energy
Small scale photovoltaiques
Small scale hydropower
SDG 8 - Decent Work and Economic Growth
Industry energy efficiency
Households energy efficiency
SDG 9 – Industry, Innovation and Infrastructure
Paved Roads
Railways
SDG 10 – Reduced Inequalities
Fiscal Pressure Distribution
Changes the distribution by income percentile. Normally, the majority of fiscal pressure go to the higher percentiles.
Interest Rate on Foreign Debt
Minimum Salary Relative to Average
Net Migration Rate per 1000
SDG 11 – Sustainble Cities and Communities
Vehicles Energy Efficiency
Waste Management
SDG 12 – Responsible Consumption and Production
Large Scale Photovoltaiques
Large Scale Hydropower
Target Material Consumption Efficiency Improvement
SDG 13 – Climate Action
Climate Change Adaptation
SDG 14 – Life Below Water
Marine Areas Protection
SDG 15 - Life on Land
Terrestrial Areas Protection
Reforestation
SDG 16 – Peace, Justice and Strong Institutions
Governance levels
Min -2.5, Max 2.5
SDG 17 - Partnership for the Goals
These interventions are for financing of interventions (government income to cover the cost of interventions).
Direct tax revenue
Indirect Taxes
Foreign Grants
International Trade Taxes
Options on the control panel (before simulation)
Set Budget
In addition to the method using graphs by SDG shown above, other methods of adding interventions exist through this option (by percentage of Gross Domestic Product, by local currency, or by US dollar). It is not possible to mix these methods.
Check Financing
To check how interventions are paid. Additional expenditure paid by private sources, taxes, grants and loans are shown (as a percentage of Gross Domestic Product).
Model Overview
To look at the structure of the model.
Reset All
To reset the settings of the simulation.
Reload Policies
To load a simulation already completed (from your computer).
History and Validity
To look at graphs with a comparison of the simulation with historical data.
Options on the control panel (after simulation)
SDG Table
A table with the values of each indicator available of each SDG for each year between the present and 2030.
All Graphs
Graphs with simulation results and Business as Usual case (BAU).
Array Explorer
Graphs with simulation results and Business as Usual case (BAU) for variables that have differing elements (for example, sex, age, production sector, etc.).
Export Data
To export the performance of each SDG to a CSV file.
Modify Policies
To modify interventions and settings.
Save Policies
To save interventions and settings (on your computer).
Start New Run
To reset the settings of the simulation.
Access from the model
The user interface is directly accessible from the Stella software itself (accessibility may vary depending on the version of Stella). This is an alternative to running scenarios through the online interface (if made available), manipulations on the model directly, or through spreadsheets. The advantage of using the interface for simulations is its simplicity: user does not need any knowledge of the model to run them. The disadvantage of using the interface for simulations is the limited choice of interventions to compare to what can be achieved using the model directly.
On Stella’s main screen, on the top horizontal toolbar, click the “Open Interface Window” button

The Interface editor will then be opened. We do not recommend editing the interface (advanced users only).
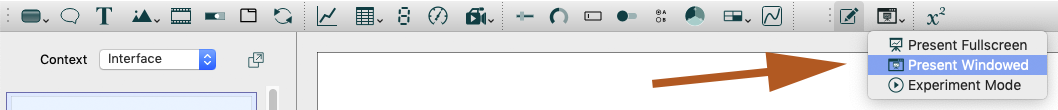
In the interface select “Presentation Mode” then “Present Windowed”. The interface will appear.
Important! Because the user interface here directly modifies the model, the runs you make in the interface also run in the model (so you’ll be able to refer back to the runs later, if you save them in the model’s run manager – stack of coins). Additionally, any settings you make in the interface will be saved, thus, before quitting the interface, ensure that you click Reset Policies or Start New Run on the main control panel, or else your settings will be saved in all future runs of the model.